RSS

Concord Metrotown
Nelson Avenue & Kingsway, Burnaby, BC


Tpye of home: 1 bedroom, 2 bedrooms, 3 bedrooms
Total towers: 8
Total units: 1400
Size: 1 bedroom (468 ~ 558 sq.ft.)
          2 bedrooms (797 ~ 952 sq.ft.)
          3 bedrooms (1072 ~ 1933 sq.ft.)
Architect: IBI Group
Interior designer: LIV Interiors
Developer: Concord Pacific
Est. Completion: Spring 2026


Read

The provincial housing market had a record-setting September

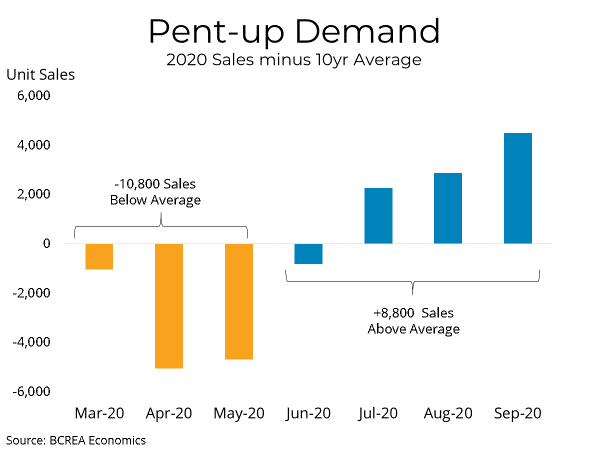
Vancouver, BC – October 14, 2020. The British Columbia Real Estate Association (BCREA) reports that a total of 11,368 residential unit sales were recorded by the Multiple Listing Service® (MLS®) in September 2020, an increase of 63.3 per cent from September 2019. The average MLS® residential price in BC set a monthly record of $803,210, a 15.3 per cent increase from $696,647 recorded the previous year. Total sales dollar volume in August was $9.1 billion, an 88.3 per cent increase over 2019. 

“The provincial housing market had a record-setting September,” said BCREA Chief Economist Brendon Ogmundson. “Both total sales and average prices were the highest ever for the month of September as pent-up demand from the spring pushes into the fall.”

“Average prices are skewing higher as demand for space during the pandemic drives sales of single-detached homes,” added Ogmundson. Total provincial active listings are still down about 12 per cent year-over-year, with some markets even more under-supplied as the pandemic continues to keep listings low.

Year-to-date, BC residential sales dollar volume was up 25.1 per cent to $49.7 billion, compared with the same period in 2019. Residential unit sales were up 12.5 per cent to 65,023 units, while the average MLS® residential price was up 11.2 per cent to $764,298.  


Read

Home sale activity up, supply down to start 2020

Home sale and price activity remained steady in Metro Vancouver* to start 2020 while home listing activity declined in January.


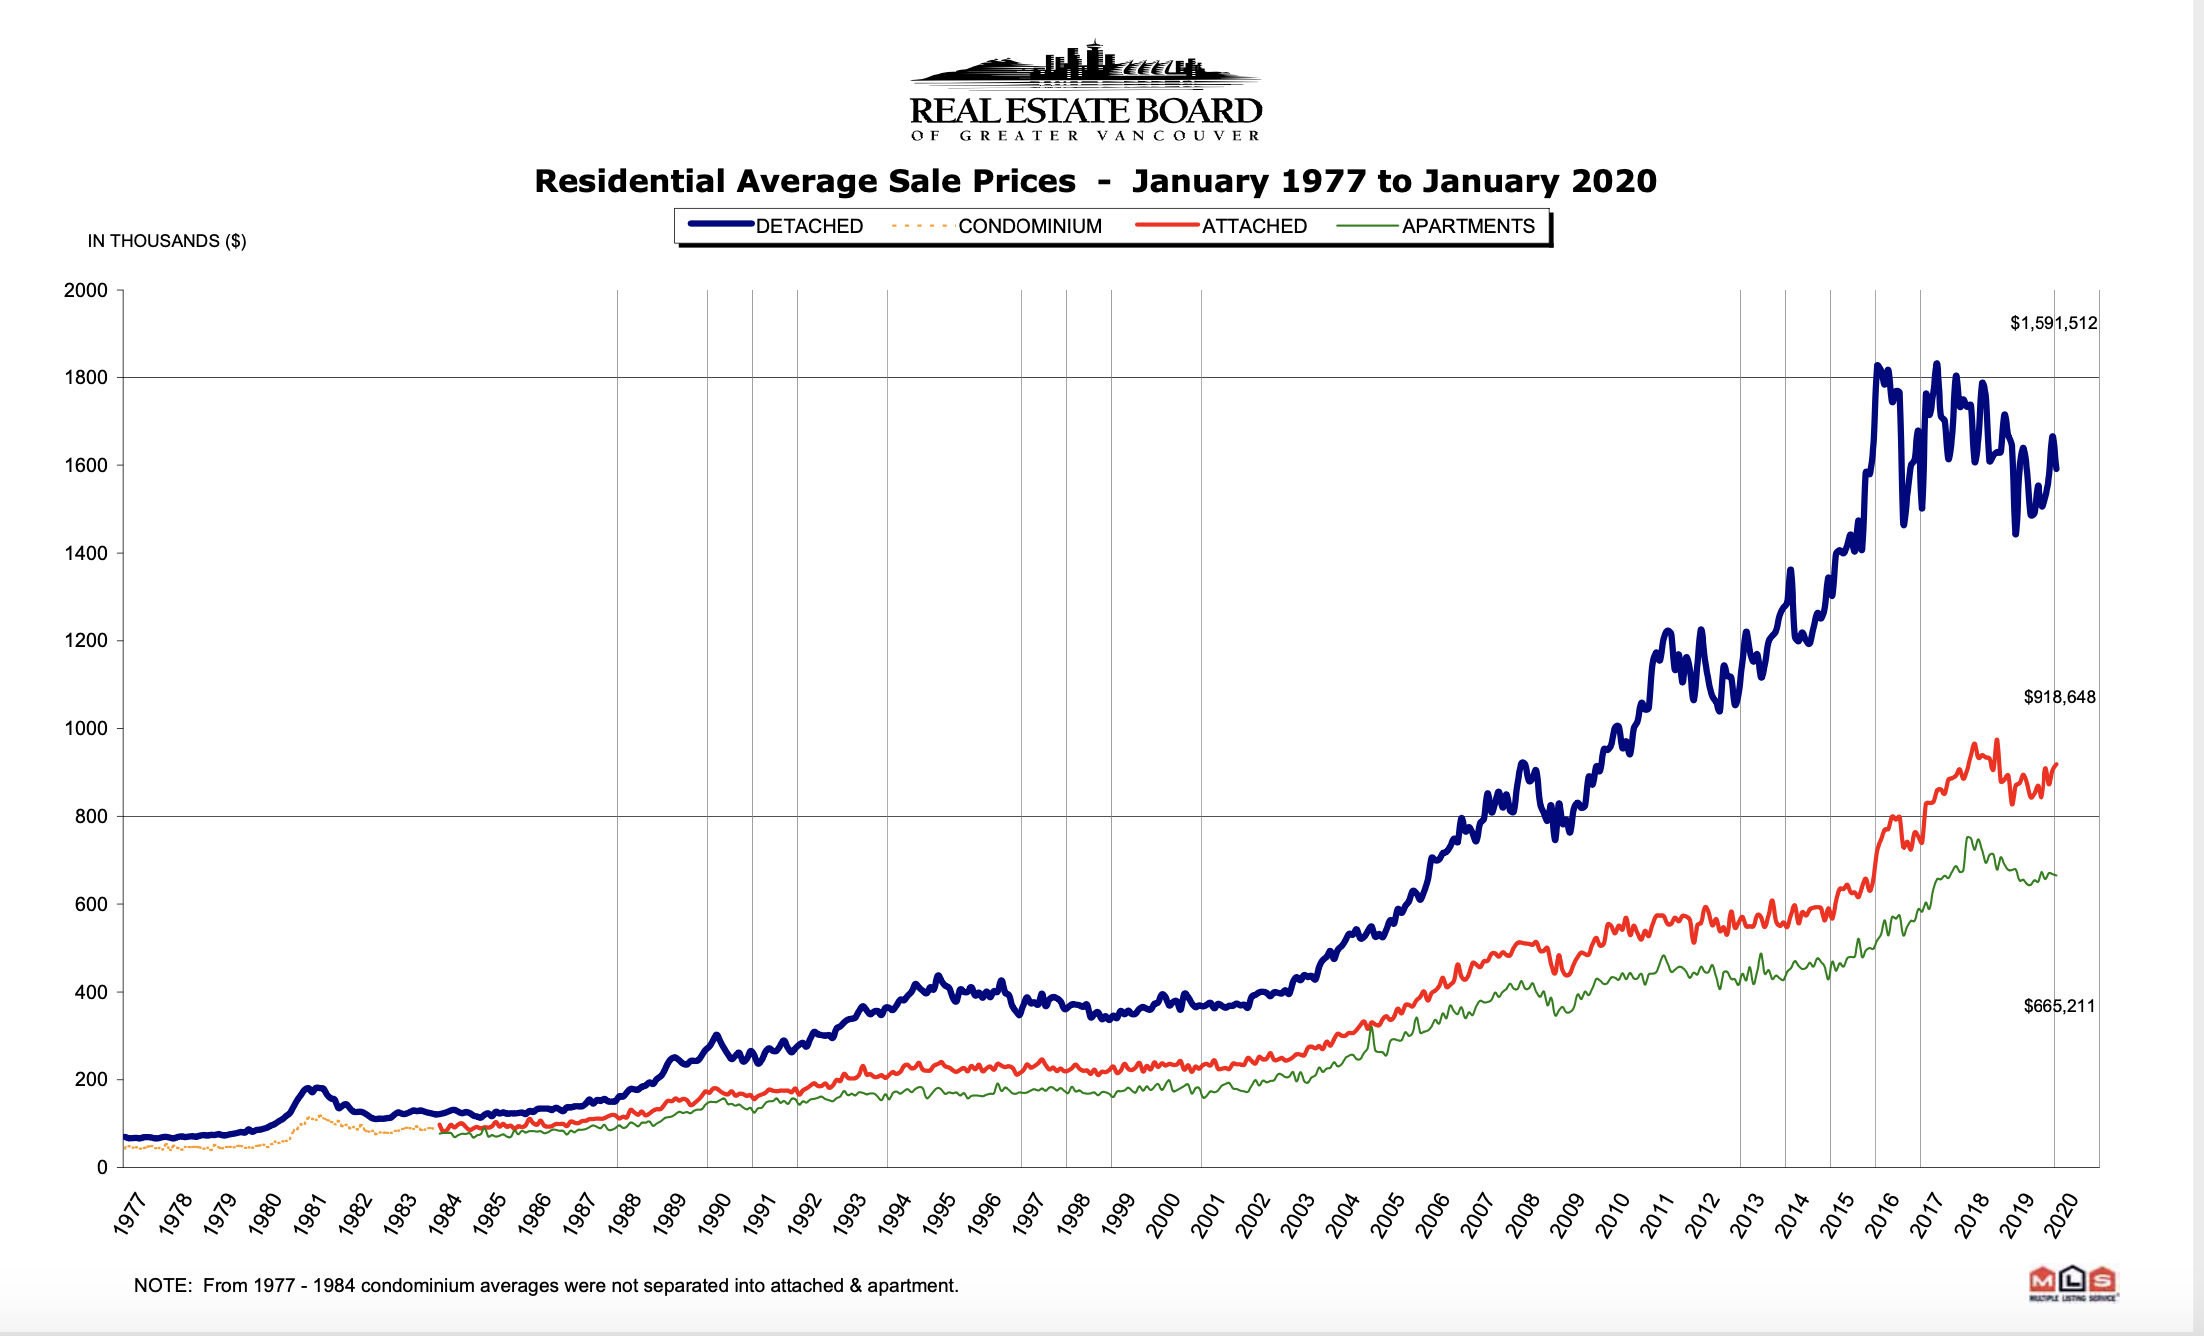
The MLS® Home Price Index composite benchmark price for all residential properties in Metro Vancouver is currently $1,008,700. This represents a 1.2 per cent decrease over January 2019, a 1.4 per cent increase over the past six months, and a 0.8 per cent increase compared to December 2019.


Sales of detached homes in January 2020 reached 439, a 29.5 per cent increase from the 339 detached sales recorded in January 2019. The benchmark price for detached properties is $1,431,200. This represents a 1.7 per cent decrease from January 2019, a one per cent increase over the past six months, and a 0.5 per cent increase compared to December 2019.


Sales of apartment homes reached 814 in January 2020, a 45.6 per cent increase compared to the 559 sales in January 2019. The benchmark price of an apartment property is $663,200. This represents a one per cent decrease from January 2019, a 1.5 per cent increase over the past six months, and a one per cent increase compared to December 2019.


Attached home sales in January 2020 totalled 318, a 55.1 per cent increase compared to the 205 sales in January 2019. The benchmark price of an attached unit is $782,500. This represents a 0.7 per cent decrease from January 2019, a 1.6 per cent increase over the past six months, and a 0.5 per cent increase compared to December 2019.


Read

Home buyer activity increases in October 2019


Sales of detached homes in October 2019 reached 938, a 47.3 per cent increase from the 637 detached sales recorded in October 2018. The benchmark price for a detached home is $1,410,500. This represents a 7.5 per cent decrease from October 2018, a 1.3 per cent decrease over the past six months, and a 0.3 per cent increase compared to September 2019.


Sales of apartment homes reached 1,384 in October 2019, a 40.5 per cent increase compared to the 985 sales in October 2018. The benchmark price of an apartment home is $652,500. This represents a 5.9 per cent decrease from October 2018, a 2.2 per cent decrease over the past six months, and a 0.2 per cent increase compared to September 2019.


Attached home sales in October 2019 totalled 536, a 55.8 per cent increase compared to the 344 sales in October 2018. The benchmark price of an attached home is $771,600. This represents a 5.8 per cent decrease from October 2018, a 0.4 per cent decrease over the past six months, and a 0.5 per cent increase compared to September 2019.


Read

September 2019 Real Estate Market Update 


Check out real estate updates in your area here. All types of properties continuately decreasing in September, except two areas........


Contact Ivy Shih for your Real Estate questions or thinking of buying / selling your home. 
Read

Richmond July Market Updates 2018
Detached houses continue to weaken in July. It has dropped by 2.3% since July last year. On the comtrary, Condos and Townhouses are showing strength in this uncertain market. Condos grown 17.4% since July 2017 and Townhoues increased 10.4%. Hopefully we are able to see more staibility of detached houses in the 3rd quarter.
Read

Housing supply up, demand down across Metro

New Number from Real Estate Board of Greater Vancouver for July 2018:


Sales of detached properties in July 2018 reached 637, a decrease of 32.9 per cent from the 949 detached sales recorded in July 2017. The benchmark price for detached properties is $1,588,400. This represents a 1.5 per cent decrease from July 2017 and a 0.6 per cent decrease compared to June 2018.


Sales of apartment properties reached 1,079 in July 2018, a decrease of 26.5 per cent compared to the 1,468 sales in July 2017. The benchmark price of an apartment property is $700,500. This represents a 13.6 per cent increase from July 2017 and a 0.5 per cent decrease compared to June 2018.


Attached property sales in July 2018 totalled 354, a decrease of 34.8 per cent compared to the 543 sales in July 2017. The benchmark price of an attached unit is $856,000. This represents a 12.1 per cent increase from July 2017 and a 0.4 per cent decrease compared to June 2018.


Read

Home sales down, listings up across Metro Vancouver

The Metro Vancouver housing market saw fewer home buyers and more home sellers in April.

The Real Estate Board of Greater Vancouver (REBGV) reports that residential property sales in the region totalled 2,579 in April 2018, a 27.4 per cent decrease from the 3,553 sales recorded in April 2017, and a 2.5 per cent increase compared to March 2018 when 2,517 homes sold.

Last month’s sales were 22.5 per cent below the 10-year April sales average.

“Market conditions are changing. Home sales declined in our region last month to a 17-year April low and home sellers have become more active than we’ve seen in the past three years,” Phil Moore, REBGV president said. “The mortgage requirements that the federal government implemented this year have, among other factors, diminished home buyers’ purchasing power and they’re being felt on the buyer side today.”

There were 5,820 detached, attached and apartment properties newly listed for sale on the Multiple Listing Service® (MLS®) in Metro Vancouver in April 2018. This represents an 18.6 per cent increase compared to the 4,907 homes listed in April 2017 and a 30.8 per cent increase compared to March 2018 when 4,450 homes were listed.

The total number of properties currently listed for sale on the MLS® system in Metro Vancouver is 9,822, a 25.7 per cent increase compared to April 2017 (7,813) and a 17.2 per cent increase compared to March 2018 (8,380).

“Home buyers have more breathing room this spring. They have more selection to choose from and less demand to compete against,” Moore said.

For all property types, the sales-to-active listings ratio for April 2018 is 26.3 per cent. By property type, the ratio is 14.1 per cent for detached homes, 36.1 per cent for townhomes, and 46.7 per cent for condominiums.

Generally, analysts say that downward pressure on home prices occurs when the ratio dips below the 12 per cent mark for a sustained period, while home prices often experience upward pressure when it surpasses 20 per cent over several months.

The MLS® Home Price Index composite benchmark price for all residential properties in Metro Vancouver is currently $1,092,000. This represents a 14.3 per cent increase over April 2017 and a 0.7 per cent increase compared to March 2018.

Sales of detached properties in April 2018 reached 807, a 33.4 per cent decrease from the 1,211 detached sales recorded in April 2017. The benchmark price for detached properties is $1,605,800. This represents a 5.1 per cent increase from April 2017 and a 0.2 per cent decrease compared to March 2018.

Sales of apartment properties reached 1,308 in April 2018, a 24 per cent decrease from the 1,722 sales in April 2017. The benchmark price of an apartment property is $701,000. This represents a 23.7 per cent increase from April 2017 and a 1.1 per cent increase compared to March 2018.

Attached property sales in April 2018 totalled 464, a 25.2 per cent decrease compared to the 620 sales in April 2017. The benchmark price of an attached unit is $854,200. This represents a 17.7 per cent increase from April 2017 and a 2.3 per cent increase compared to March 2018.


Source from REBGV

Read

Marquise, Pre-Sale Condo on Cambie and King Edward is now selling! It has total 58 residential unitls. 23 one bedroom units, 21 two bedroom units. 7 three bedroom units and 7 townhomes. Call me if you are looking to purchase Marquise or Cambie Corridor properties!


Contact Ivy Shih for home selections! 778-862-3630


Marquise PreviewPackage a Kit Updated by Ivy on Scribd

Read
Reciprocity Logo The data relating to real estate on this website comes in part from the MLS® Reciprocity program of either the Greater Vancouver REALTORS® (GVR), the Fraser Valley Real Estate Board (FVREB) or the Chilliwack and District Real Estate Board (CADREB). Real estate listings held by participating real estate firms are marked with the MLS® logo and detailed information about the listing includes the name of the listing agent. This representation is based in whole or part on data generated by either the GVR, the FVREB or the CADREB which assumes no responsibility for its accuracy. The materials contained on this page may not be reproduced without the express written consent of either the GVR, the FVREB or the CADREB.